Executive Analytics
Turn fragmented operational and financial data into decision-ready dashboards, management reporting, forecasting, and executive insights.
Solutions
From executive analytics to AI assistants and connected operations, Infoseer brings the right capabilities together around the work your organization needs to improve.
Our services
Turn fragmented operational and financial data into decision-ready dashboards, management reporting, forecasting, and executive insights.
Deploy practical AI assistants that summarize information, prepare reports, answer business questions, route requests, automate repetitive work, and support day-to-day operations.
Redesign and automate end-to-end workflows to reduce bottlenecks, shorten turnaround times, improve handoffs, and keep work moving across teams.
Bring data, applications, workflows, and teams into a connected operating environment that provides shared visibility and a stronger foundation for automation.
Consolidate information from spreadsheets, databases, cloud systems, ERP platforms, and operational applications into reliable, usable business data.
Use historical and operational data to support forecasting, scenario analysis, anomaly detection, demand planning, and forward-looking decisions.
Use AI to extract, classify, summarize, validate, and route information from contracts, invoices, reports, forms, applications, and other business documents.
Identify where work is getting stuck, measure cycle times and workload, surface operational issues, and uncover opportunities for improvement or automation.
Build fit-for-purpose internal applications, portals, approval systems, procurement systems, lending workflows, operational tools, and other business solutions.
Help organizations determine where AI, analytics, automation, and modern data platforms can create realistic business value before making major technology investments.
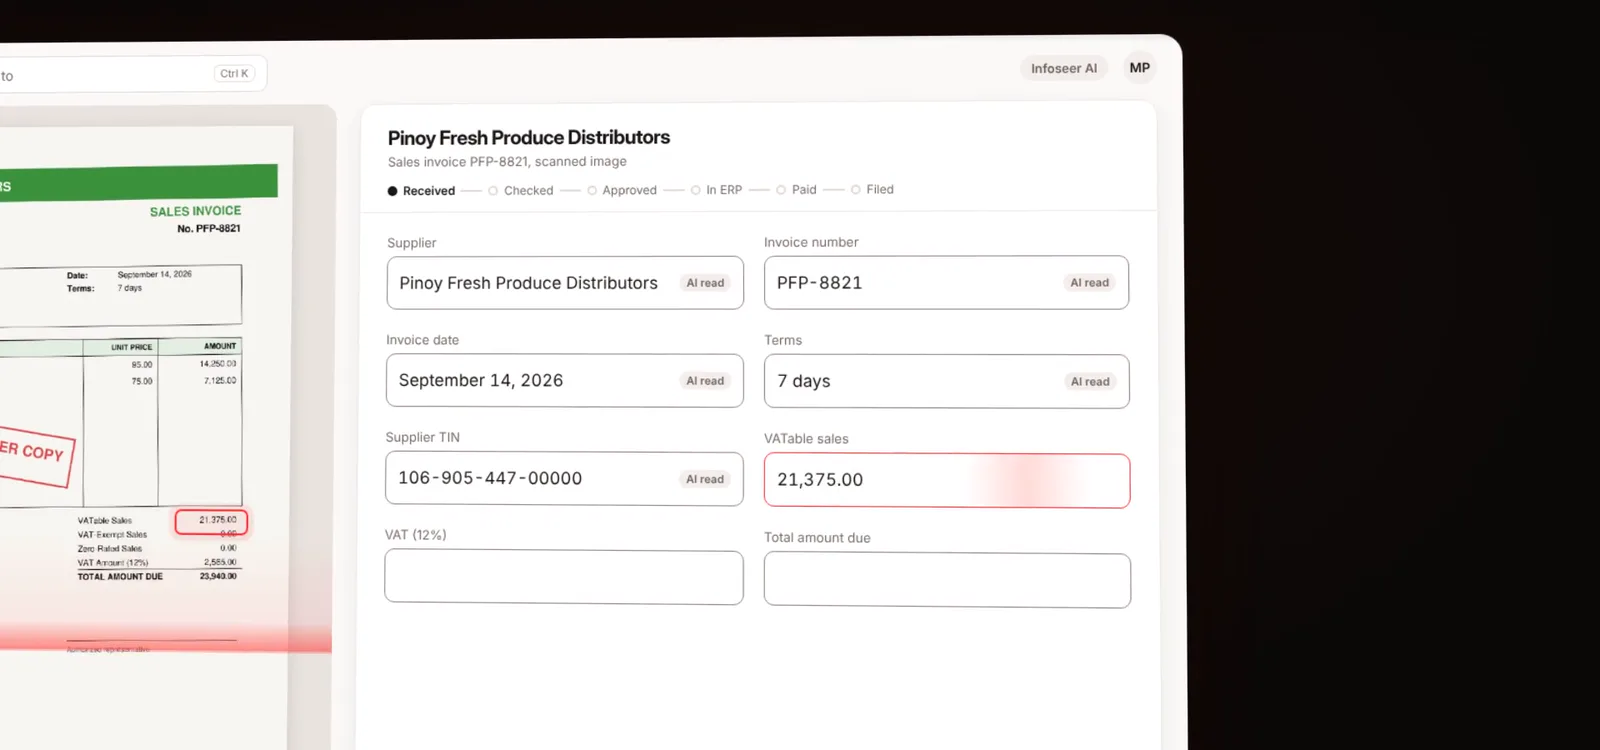 Featured product · Unified Business PlatformUBP for Accounting: supplier invoices from paper to paidSee the demo →
The engagements below are practical ways to begin. We scope the combination of services around the result you need.
01 · Visibility Sprint
This fits when important figures are assembled manually, arrive too late, or produce avoidable debate about which number is right.
We define the decisions that need support, agree the relevant measures, map their sources, and create a dependable path from source data to a management view people can use.
02 · Workflow Automation Sprint
This fits when people repeatedly enter information, route documents, follow up for status, or manage approvals across disconnected channels.
We map the workflow and its exceptions, identify where time and control are lost, then redesign and automate the selected process with human review where judgment still matters.
03 · Operations System
This fits when recurring operations depend on spreadsheets, chat threads, shared documents, or paper to coordinate work.
We design an operating flow around the people, roles, records, decisions, and controls the process needs—then connect the supporting systems where that creates real value.
04 · Analytics Modernization
This fits when data already exists but definitions are inconsistent, reporting is fragile, or the current architecture cannot support reliable decisions.
We examine the present data path, clarify the information and governance needs, and build a staged modernization plan around the decisions the organization needs to make.
05 · AI Adoption Workshop
This fits when leadership wants a practical AI starting point without buying a tool before the use case is clear.
We identify candidate workflows, assess value, feasibility, and governance, and leave leadership with a prioritized view of what to test, what to prepare, and what not to pursue yet.
06 · Infoseer Care
Infoseer Care is the continuity layer for delivered workflows, information, and systems. Its scope is agreed around the outcome and the responsibilities that need ongoing ownership.
Depending on the engagement, Care may cover monitoring, support, fixes, backups, minor improvements, analytics review, security updates, and periodic business review.
AINS delivery principle
Microsoft Azure, Fabric, Power Platform, Power BI, AI platforms, existing business systems, and custom software may all support an outcome. The workflow, information, controls, scale, and economics decide what belongs in the solution.
Timelines, service levels, architecture, and measures of success are defined for the specific engagement rather than promised universally.
Describe the operating problem in plain language. You do not need to diagnose the technology before speaking with us.